Introduction
LibreNMS is a fantastic open source NMS which I have been using for some time to monitor statistics on my network devices and servers. The SNMP-based monitoring it offers is very simple to set up and provides fantastic insights into a variety of devices.
I recently spun up some Halo Online \ Eldewrito servers and wanted to keep track of the performance of the servers, so I could know the capacity of my VM hypervisor which I dedicated to the project. My first step was configuring LibreNMS and monitoring the basic server statistics, but I really wanted to take this a step further, and correlate that data to the player count on the server. Since Eldewrito is a community based game, a lot of tools are very limited, so tools such as GameTracker aren’t supportive of the game.
Fortunately, Eldewrito has a very simple query port usage and returns simple JSON data, so I was off to figuring out how to get this done.
The Approach
After consulting with some LibreNMS community members on their Discord, it was pointed out to me that LibreNMS supports Nagios plugins, so I got to work writing my own.
My Nagios Plugin
I have published the code for my Nagios plugin on Github. The repository can be found here, and a direct link to the plugin file here.
If you are setting this up, download the plugin file, and proceed with this article.
LibreNMS Nagios Plugin Setup
LibreNMS provides excellent documentation on how to set up Nagios plugin support, you can find it here. I am not going to cover this entire setup here, only the parts necessary to get this plugin working. If you aren’t going to use other Nagios plugins, you don’t need to follow the rest of their guide’s steps either, but it’s there for your reference if the configuration steps change down the road.
The only steps which were required for the setup I wanted were:
- Update the LibreNMS config.php, add the following lines:
$config['show_services']           = 1;
$config['nagios_plugins']   = "/usr/lib/nagios/plugins";
- Create the Nagios plugins directory:
mkdir -p /usr/lib/nagios/plugins/
- Place my plugin file (found in the above section) in this directory.
- Make the plugin file executable:
chmod +x /usr/lib/nagios/plugins/check_eldewrito
- Your LibreNMS cron in /etc/cron.d/librenms needs a line which is checking the services. Mine had this line already, so I didn’t need to change anything. If yours doesn’t, you could try adding mine or consult the LibreNMS documentation above.
*/5 * * * * librenms /opt/librenms/check-services.php >> /dev/null 2>&1
Set Up Your Monitor!
Now that you’ve done the above, LibreNMS should display a Services tab at the top. Navigate there to add a new service monitor.
On this tab, your next step is filling in the details for the plugin to work.
You will need to know the IP address of your Eldewrito server, as well as the query port. The default query port is 11775.
Enter the following options:
- Device – Choose the server which you are hosting the Eldewrito server on.
- Type – Select check_eldewrito to use our script. This should be the filename of the file you put in your plugins folder, if you changed it.
- Description – Enter whatever you please here, I don’t care. 🙂
- IP Address – Can be left blank and LibreNMS will autofill the device’s IP, or you can type the device’s IP if you enjoy verbosity like I do.
- Parameters – Just enter the query port of the Eldewrito server here, default is 11775.
Locating The Graph & Data
Once you’ve set up your first service monitor, go grab a cup of coffee or some dinner. Allow at least 5-10 minutes for the graphing to start.
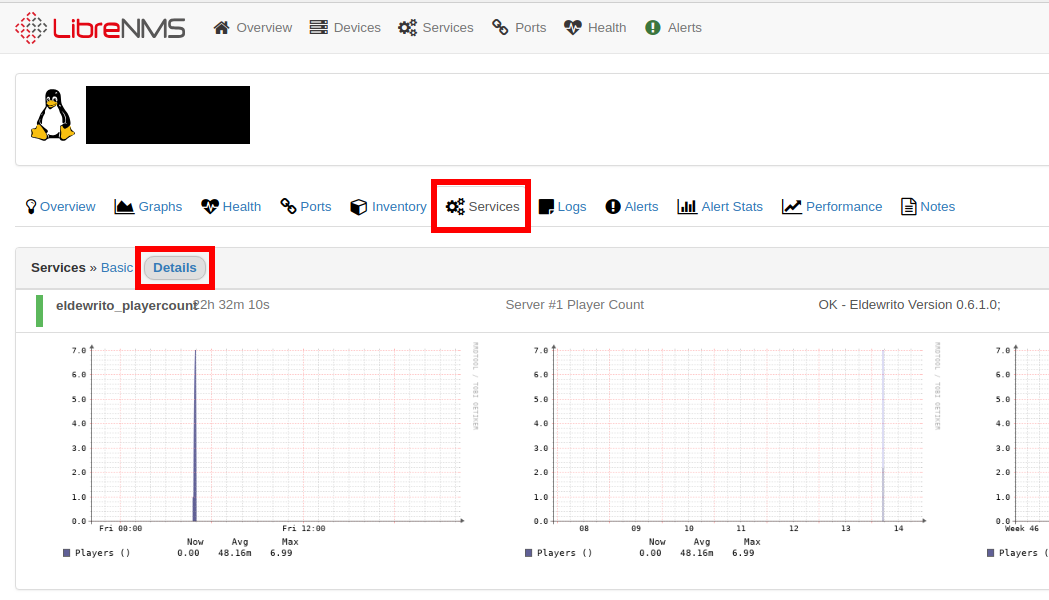
The graph is located under the Services tab, you can either click on the device and go to its services tab, or you can go to the services tab on the top and click “All Services”. You’ll need to toggle the tab from Basic to Detailed as well to see the graph.
Unfortunately on my version of LibreNMS there are some styling issues, the last check time overlaps the plugin check name a bit. Maybe they will correct this in a future update, it is mostly a cosmetic issue anyway.
There you have it! You can add this plugin on multiple server devices in LibreNMS, or use it on the same server several times across multiple ports. The possibilities are quite endless! It’s possible to extend the plugin to gather other statistics from the server as well, but for the moment, player count was of the most interest to me.
Please feel free to leave a comment here or open an issue on the Github if you run into any questions or problems with the plugin, and I’ll be happy to take a look.


Recent Comments