Tag Archives: Ubiquiti

Running Land Elevation Surveys With Google Earth

Background Information

Living in a rural area, I am often tasked with finding ways to connect remote sites to the Internet in places where cable and DSL are not available.  In these situations, the best alternative is usually the local wireless Internet service provider (WISP).

Many of these providers utilize point-to-point (PTP) and point-to-multipoint (PTMP) wireless connections running on non-licensed frequencies (900MHz, 2.4GHz, 5GHz, and others) to provide service to these types of hard to reach locations.

These connections work best with a line of sight (LOS) between your location and your ISP tower site.

From the ISP standpoint, determining whether an installation is viable usually comes down to visiting the site and trying to establish a connection, but running a few elevation surveys can help determine whether land barriers may have  a strong probability of obstructing the signal.

ISPs purchase expensive software tools to conduct these surveys, but a lot of it can be done with a reasonable amount of accuracy in Google Earth!

This tutorial will describe the basic steps needed to generate an elevation survey in Google’s free Google Earth desktop software.


1. Download and Install Google Earth.
At the time of this writing, Google Earth can be obtained here.

2. Locate Your Sites
Find the desired install site and the potential tower sites on Google Earth.  You can search by address, GPS coordinates (latitude & longitude), or by simply scrolling around the view.

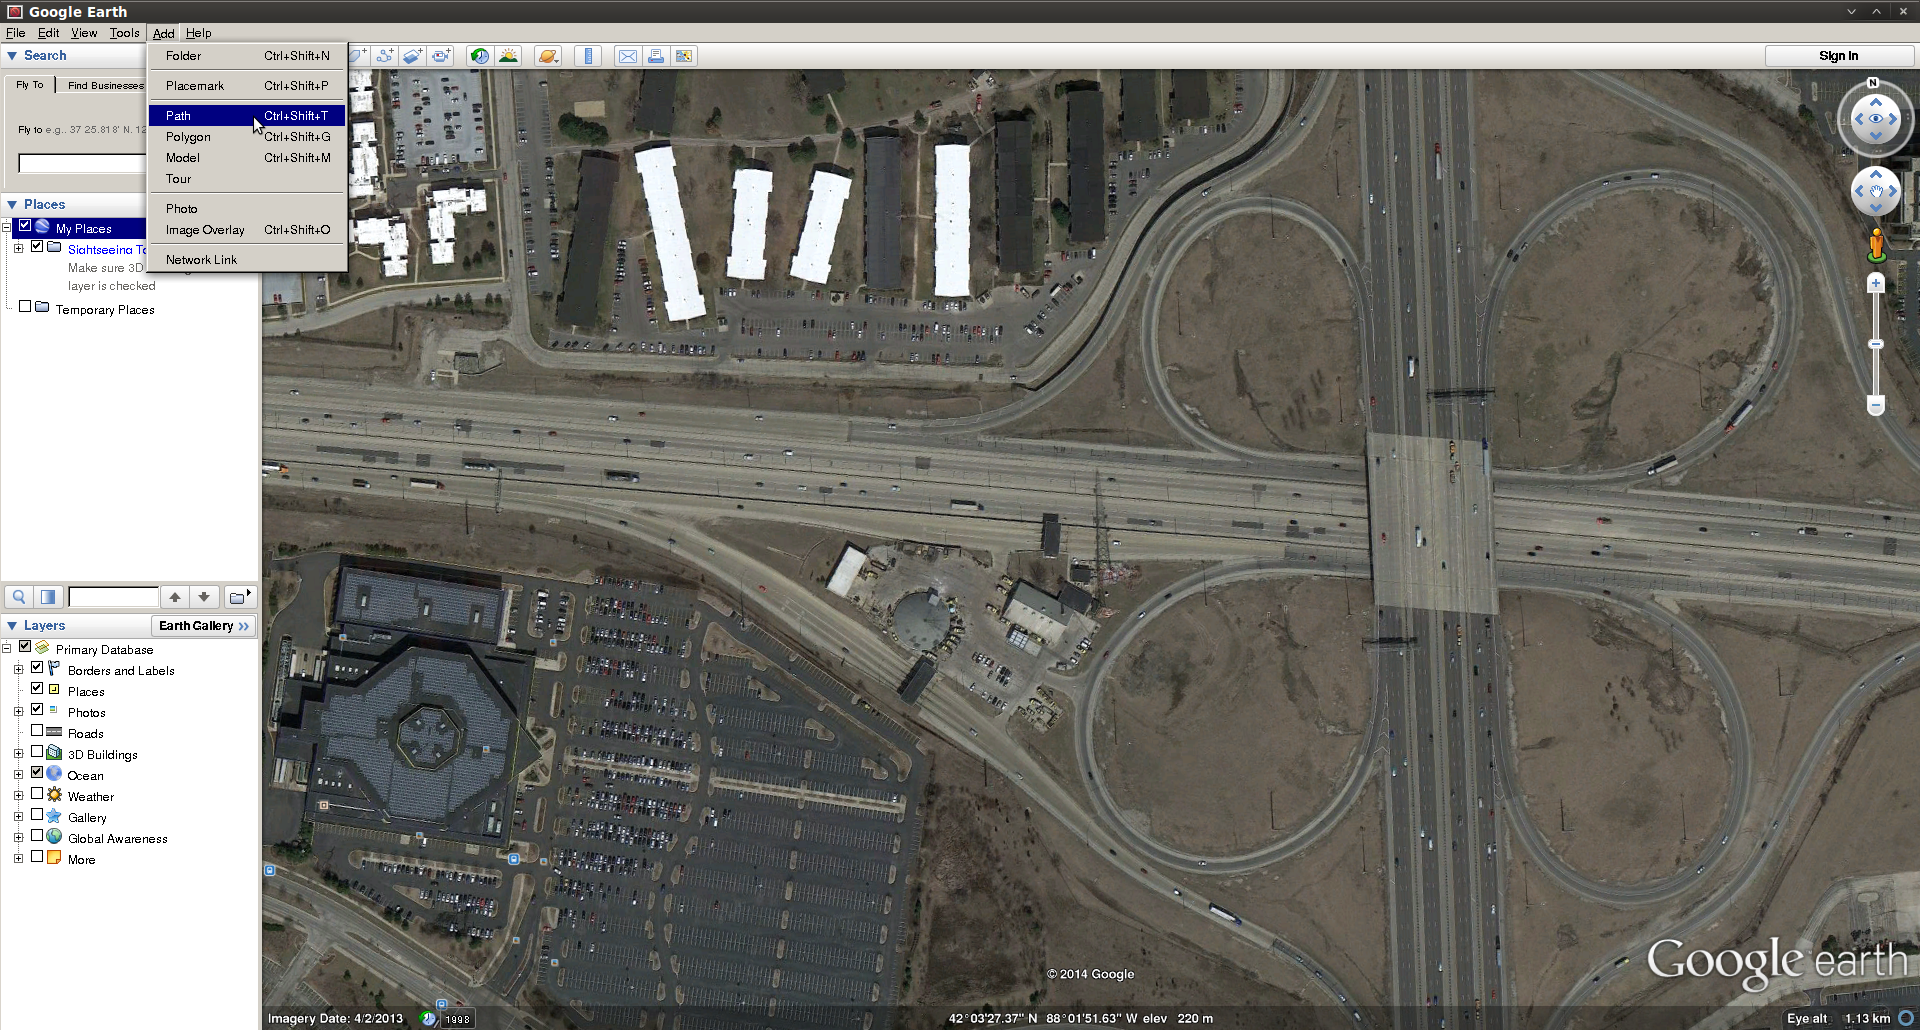
3. Go to the “Add” menu, and click “Path”.
This will open the path editor, and turn your mouse into a tool to create path points.

GoogleEarth-Add-Path


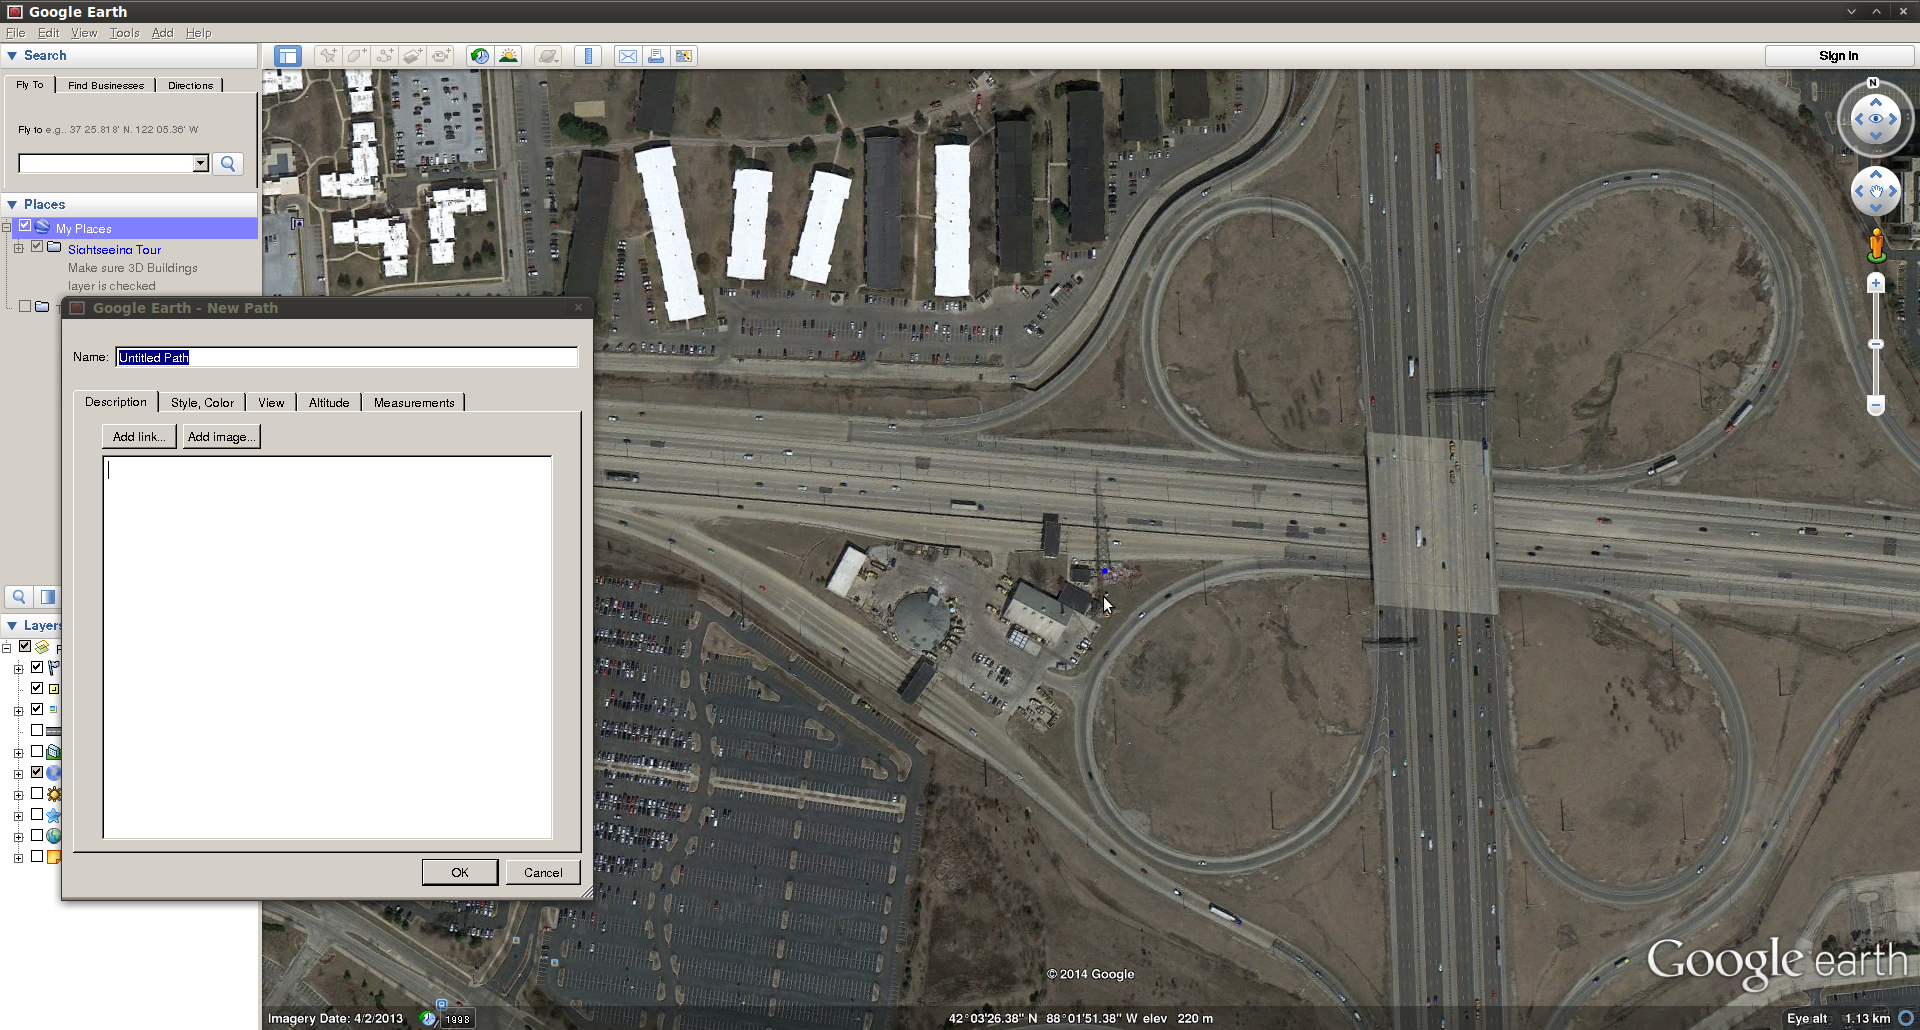
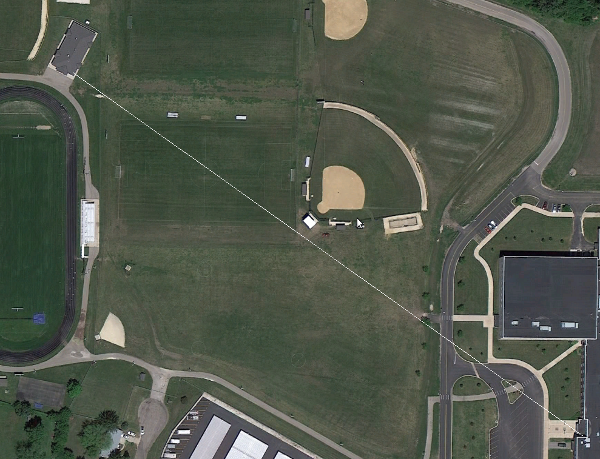
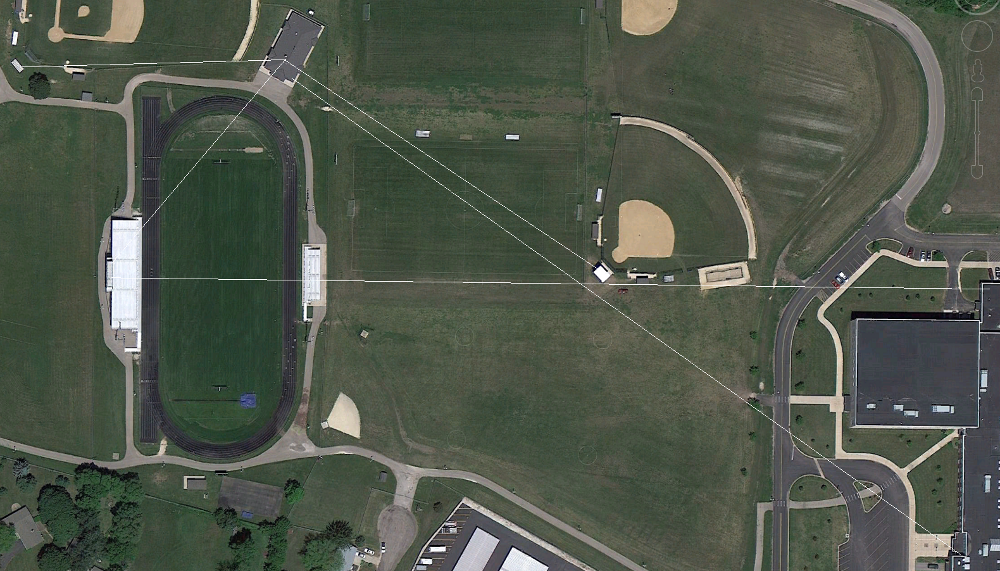
4. Locate your first site, and click once to create a path point.
This will appear on your screen as a blue dot.

GoogleEarth-Path-Dot1


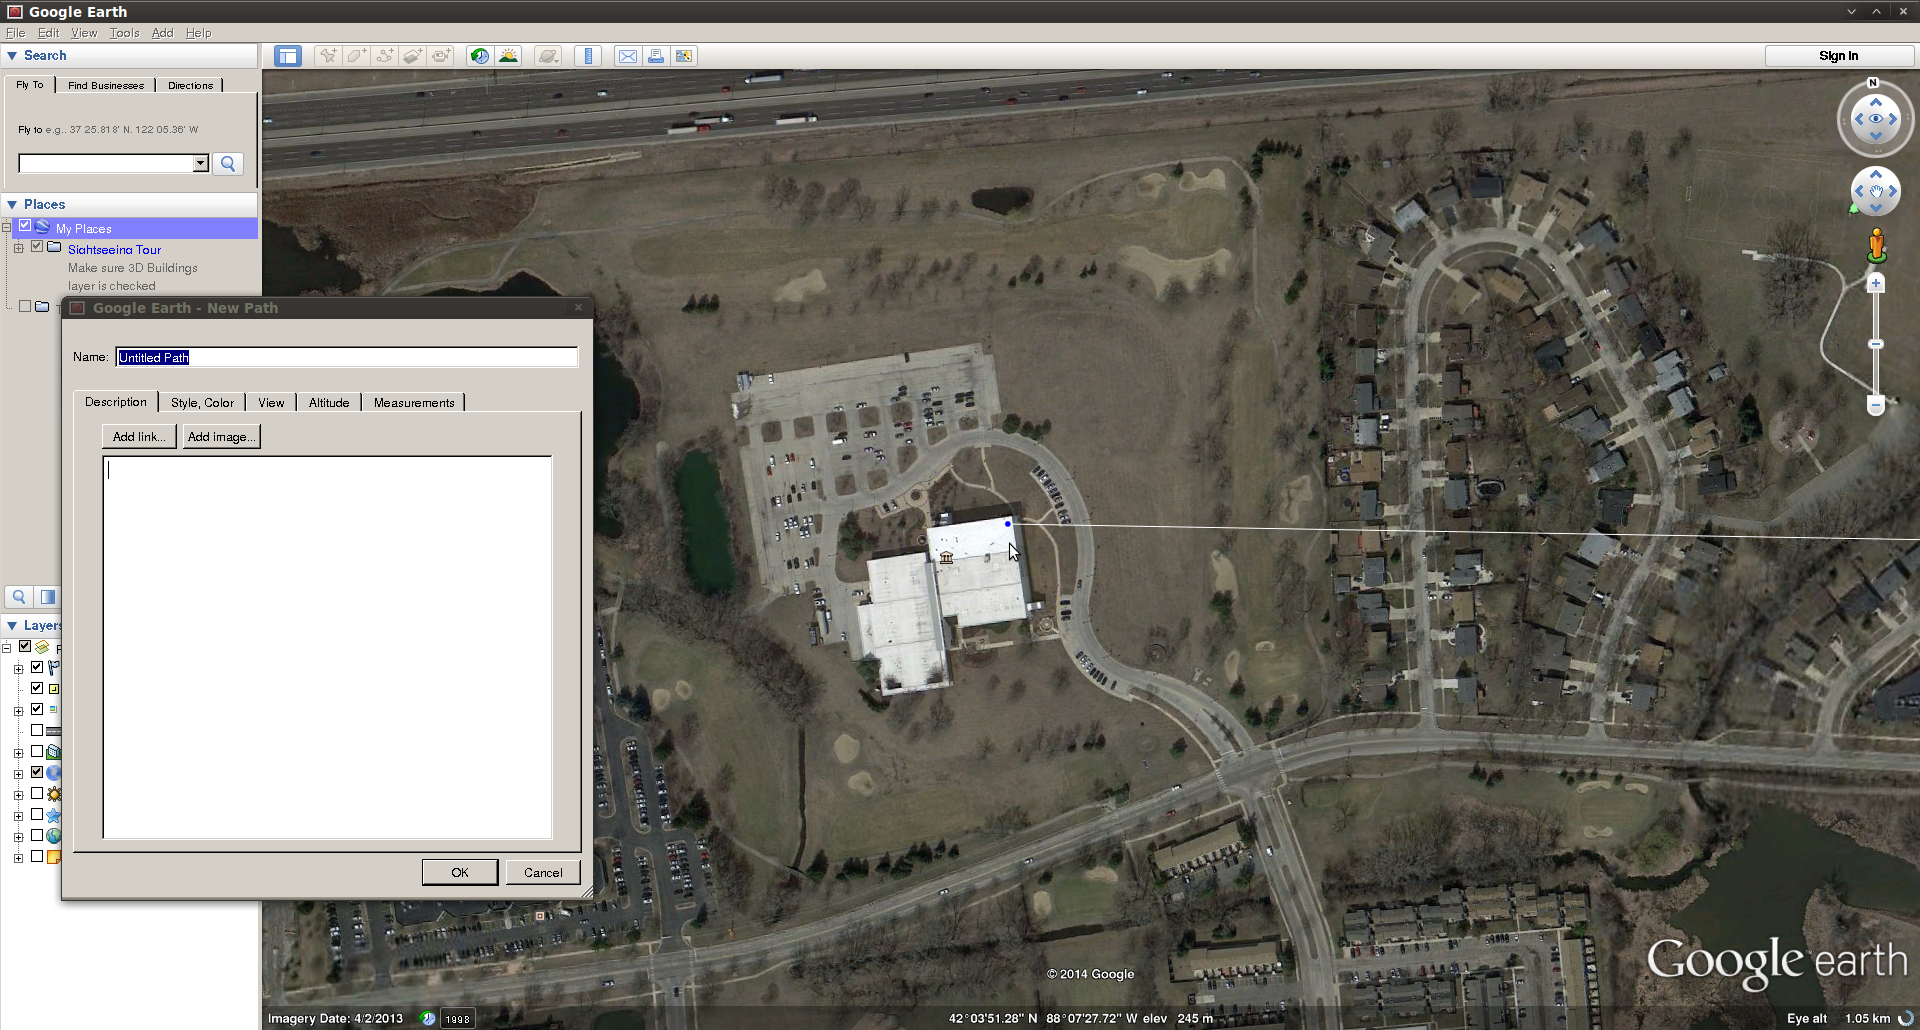
5. Locate your second site, and repeat the procedure, clicking on the site to make a path point.
This will appear on your screen as a second blue dot, and will create a white line which is your path.
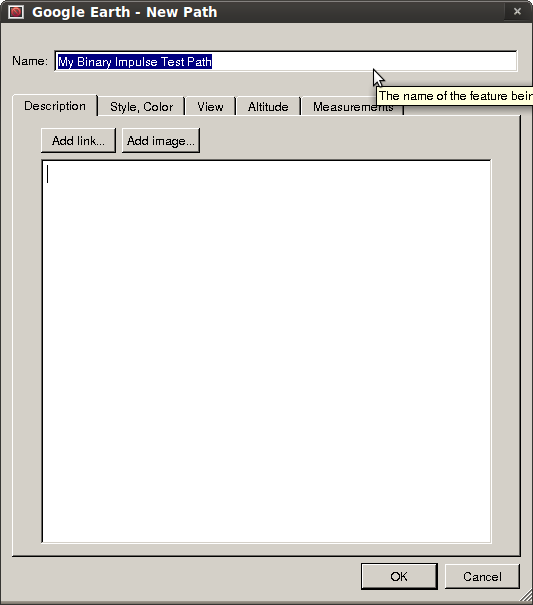
GoogleEarth-Path-Dot2


6. Name the path.
Call it something other than “Untitled Path” to describe what the path is.  (eg. Tower Site A to Customer Site B).

GoogleEarth-NamePath


7. Right click the path, and click “Show Elevation Profile”.
This will open the elevation profile view.

GoogleEarth-Show-Elevation-Profile


GoogleEarth-Showing-Elevation-Profile


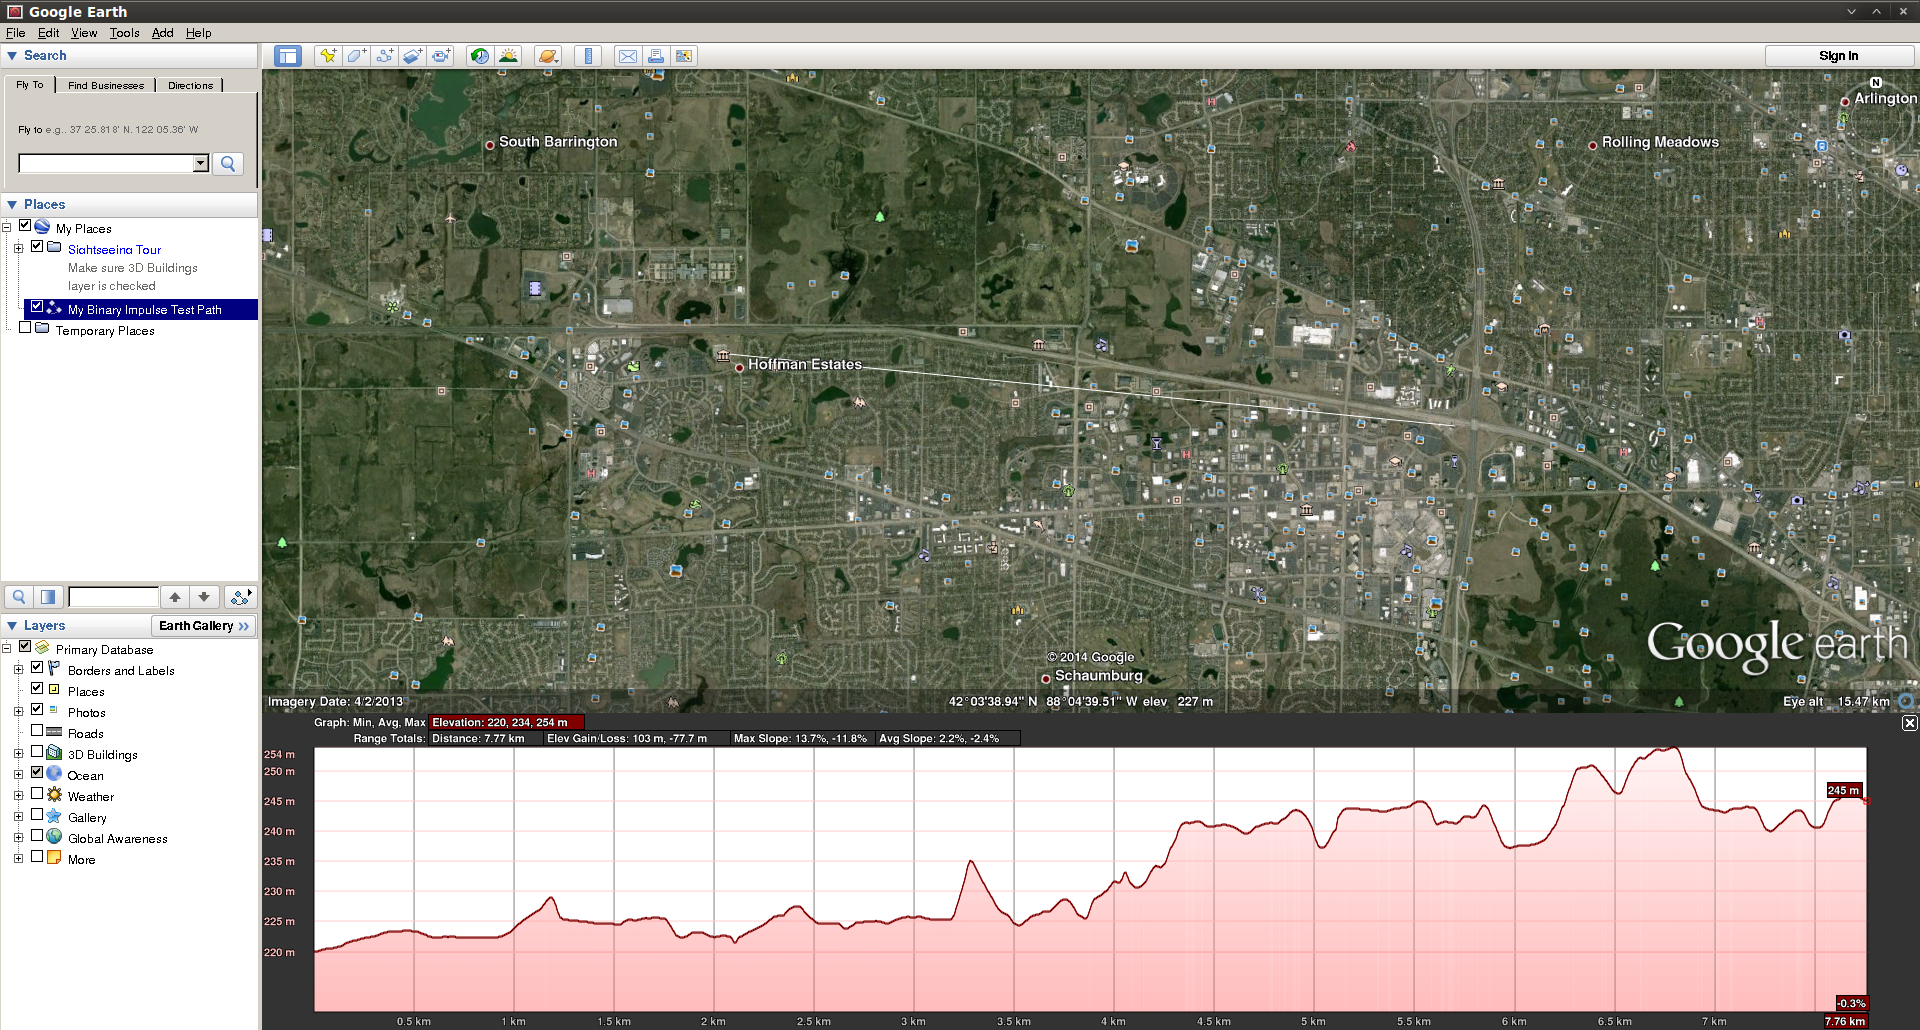
8. Expand on this, if you like.

You can create as many paths as you choose, name them accordingly, and even organize them into folders.  You can save Google Earth project files, which can be sent to customers, others at your organization, or anyone who suits your needs.

Keep in mind that the elevation profile is ground level elevation, so you will need to add heights of towers and buildings at either side to make the profile useful.

Also keep in mind that the elevation profile doesn’t know about trees and buildings in the area, so these will need to be factored in as well when determining the viability of a wireless signal.

All in all, this is a guideline and the results are not guaranteed to be useful every time, but can be a helpful tool for the WISP arsenal!

Cheap spectrum analysis for wireless

When I was going through college for networking I learned to hate wireless.  I had come to learn that it was insecure, unreliable, unpredictable, and difficult to troubleshoot.  I got into a job I love and then the wireless era began.  We are now implemented hundreds of new wireless network devices a year.  We have built out our infrastructure with a lot of time and planning and so far have been quite successful.  We use primarily Cisco equipment with some Ubiquiti back-hauls for some of our outdoor setups.  Cisco provides some very basic spectrum information, for someone who has done some in-depth work with wireless and Cisco this is enough information.  It doesn’t seem to provide any visual representation of the network which can be had to explain to upper management.  Spectrum analyzers can be thousands of dollars and for what we are doing we don’t need something that granular.  We need something to tell use when channels are overloaded/consumed with interference and if antenna’s are aligned properly during setup.

We bought a few Ubiquiti bridges a while back and noticed the AirOS product line has a built in spectrum analysis.  This is handy when selecting channels as it ensures you are not selecting a channel already in use.  We have been watching Ubiquiti for some time now and when we started running into some issues with our client wireless access I went out and bought a Ubiquiti Bullet M5 and an M2.  I think total for the both I paid about $140 (includes adapters and some antennas I had lying around).  As you might guess the M2 runs off of the 2.4Ghz spectrum and the M5 runs off the 5.8Ghz spectrum.  With the Bullets, a switch, and a windows laptop/netbook and power source we can easily run up and diagnose a problem.  This setup is also very mobile and could be brought out into the field to be worked on (barring a power source of course).

At this point in time I have been unsuccessful in getting the spectrum analysis software working in anything other than windows.

I am going to assume you can get the default information for the Ubiquiti Bullet and login.  My bullet is completely stock, no configuration needed to do what I will show you.  After logging in you get some beautiful throughput graphs and other good troubleshooting information.  There is also a drop down menu near the logout button which provides you with an AirView option.  AirView is the spectrum analyzer software.

Screenshot - 02092013 - 01:15:35 PM

Airview is a Java Network Launch Protocol application which obviously requires Java.  The analyzer in my virtual machine runs about 9 frames a second and shows pretty close to real time the actual spectrum.  Here is a 2.4Ghz snapshot of my work where our 2.4Ghz spectrum is very overloaded. Sadly this is with only a few clients in the area.


Screenshot - 02092013 - 01:54:43 PM

The top visual: Waterfall ViewThis is a good representation of channel utilization over time.  You can clearly see if a client is connected and on what channel.

The middle visual: Waveform View
This is a good visual of how often you get a signal at a certain power or signal strength.

The bottom view:  Real-time View
This is good for seeing what is happening right this second compared to the average and maximum power levels recorded.  After letting this run for a few minutes you can compare spikes and hopefully identify any problems.

I plan on using these to make future recommendations to clients and potential trend information over a period of time.  This could help identify possible interferers that could be as simple and intermittent as a microwave.  These pictures will be invaluable when trying to explain to upper management how or why we are having problems, and what should be done to correct it.


Affordable Wireless Bridge with Unlicensed Frequencies

I am a big advocate of not using wireless whenever possible for many reasons; security, interference, reliability, scale-ability, etc.  However the alternative can be extremely pricey, and just out of the question.  Our work has a building about 1400 Ft away from our primary building.  Its current network usage is nonexistent and although some feel our usage will be minimal.  I believe once we have Internet access out there we will see a much larger demand.  I am one who believes in doing it right the first time so it doesn’t have to be done again. Overbuilding is the key for longevity.  I am a big fan of Cisco equipment but in this build-out we will not be using Cisco.  They do offer some enterprise grade bridges but their cost is a little out of our budget on this project.

I played around with how to get the most amount of throughput on this, considered building two Linux boxes with directional antenna’s, priced out equipment, and came the conclusion that if we wanted a reliable connection we should go with equipment designed for what we are trying to do.  Kirk referred me to Ubiquiti We ended up purchasing the Ubiquiti Powerbridge M5 for $250 a radio (or $500 a pair).  This provides a 100Mb link on the 5.8 GHz spectrum which provides 23 non-overlapping channels compared to 2.4 GHz which only has 3.  These specific antennas are also ISP/carrier grade with a supposed distance of 20 kilometer range (don’t worry we turn the transmit power down 😛 ).

Once they arrived I went back to maintenance and grabbed some black pipe and a some scrap 3/4 In plywood.  In no time I whipped together a quick stand for testing.  I wanted something heavy on the bottom, the right size to screw into rafters when we finalized our testing, and cheap.  I also wanted to design it so I could set it on my counter top and not have to worry about scratching it up.  I was happy with the results, and the price… FREE

2013-01-01 14.22.21-scaled 2013-01-01 14.22.39-scaled

We did some testing and found what we had predicted.  These antennas were WAY OVERKILL when it comes to range and current needed throughput… and that means that they were perfect!

They come with a built in spectrum analyzer to detect interference.  Due to our location we did not have any issues with that.  Kirk or I will post some more on the ubiquiti spectrum analyzer software at a later time.  My only complaint with that software is that it only runs on windows… and Linux is my primary OS…

Screenshot-[Concession-Bridge-MCHS] - Main - Chromium

Here is a screenshot of our current setup.  SSID, MAC Addresses, IP’s are all blacked out for obvious reasons.  This is the current link seen below.  This link is about 1400 feet.

Screenshot-Google Earth

2012-10-12 15.14.53-scaled

2012-10-12 15.15.13-scaled

These are outdoor rated antennas however I feel much safer having them under the protective roof.  I know that under an asphalt roof such as this that we will have greater signal loss, that partially why we purchased the antennas we did, to help compensate for that.

Since we have done this we are now streaming video games live to the Internet.  Our usage will be growing more and more with the quality of the video being sent to the Internet.  More and more people will want access, which is why we went with something like this rather than a 54Mb 802.11g connection.

The cost to pull this off with Cisco Aironet devises would have easily been closer to 3 times the cost.  We get a Cisco AP for about $600.  We would need 2 AP’s, plus cables, plus antennas.  We pulled this off at about $500, with a faster link.  Reliability will be determined later.  Currently we have been up for 60 days without problems.

With the success of this link and demand growing to all edges of our sports fields, we plan on building a redundant wireless network of our outbuildings for a minimal cost.

Screenshot-Google Earth-1

We will be putting Cisco AP’s out there to provide edge security/connectivity.

And just because they are rated for 20 kilometer does not mean you can shoot them through trees….  I couldn’t get them do go .5 mile through some trees.

NOTE:  Awesome Android app to help aim this equipment is “true bearing”.  With my minimal experience with some of the longer range equipment this could be very helpful IMHO.